Why iOS Killed Your App Without Crashing: Jetsam, Virtual Memory, and Darwin Memory Pressure
Your app disappeared and there is no crash report. We trace memory from a Swift allocation down through Darwin virtual memory pages, physical footprint, and system pressure, then read a synthetic jetsam event report line by line.

A quick note before we start: This is a deep dive. We are going to geek out over virtual memory, kernel accounting, dirty pages, and the machinery beneath your app. It gets a little nerdy, so be patient, enjoy the ride, and do not worry if you need to pause along the way.
The crash report that does not exist
Here is a bug report you have probably received at some point.
“The app closes itself when I scroll through my photos. It just goes back to the home screen. It happens maybe once every ten minutes.”
So you go looking for the crash. You check Xcode Organizer. Nothing. You check your third-party crash reporter, the one that has never let you down. Nothing. You ask the user to reproduce it while connected to your Mac and, of course, it does not happen. Meanwhile your dashboard says your crash-free user rate is 99.8%, which is fine, which means that as far as your tooling is concerned this bug does not exist.
It does exist. Your app was not crashing. It was being jettisoned, which is iOS deciding that the device needs memory more than it needs your app, and taking your app’s memory back by force.
The distinction matters because it changes everything about how you investigate. A crash has a faulting thread and a backtrace, and it points at a line of code. A jetsam termination has neither. There is no bad pointer, no unwrapped nil, no thread to blame. The report you get instead is a JSON document describing the memory state of the entire device at the moment the operating system ran out of patience.
Three common categories of failure can make your app vanish, and they leave very different traces:
| What happened | What you get | The tell |
|---|---|---|
| Your code did something illegal | Crash report with a faulting thread and full backtrace | An exception type like EXC_BAD_ACCESS |
| You blocked the main thread too long | Crash report with a termination reason | The code 0x8badf00d, which reads as “ate bad food” |
| The system needed your memory | Jetsam event report, JSON, no backtrace at all | A memoryStatus object and a list of every process on the device |
That third row is what this article is about. We are going to follow memory the whole way down, from a Swift object you allocate, through the allocator, into Darwin virtual memory pages, into the number the kernel actually measures, and finally into the policy that decides which process dies. Then we will read a jetsam report field by field and turn it into an action.
By the end you should be able to look at an unexplained termination and say what killed it, with evidence, in about ten minutes.
The memory model iOS inherited
To understand why iOS behaves this way, it helps to know what it inherited, and what it deliberately threw away.
Before Mac OS X, the classic Mac OS made you, the user, manage memory by hand. You would select an application, open Get Info, and type a number into a box telling the system how many kilobytes that app was allowed to have. Too small and the app fell over. Too large and you starved everything else. All applications shared one address space, so a pointer bug in your word processor could scribble over the operating system and take the whole machine down with it.
Mac OS X replaced that with the model every modern OS uses, and it rests on one very good idea. Give every process its own private, imaginary address space, and lie to it convincingly.
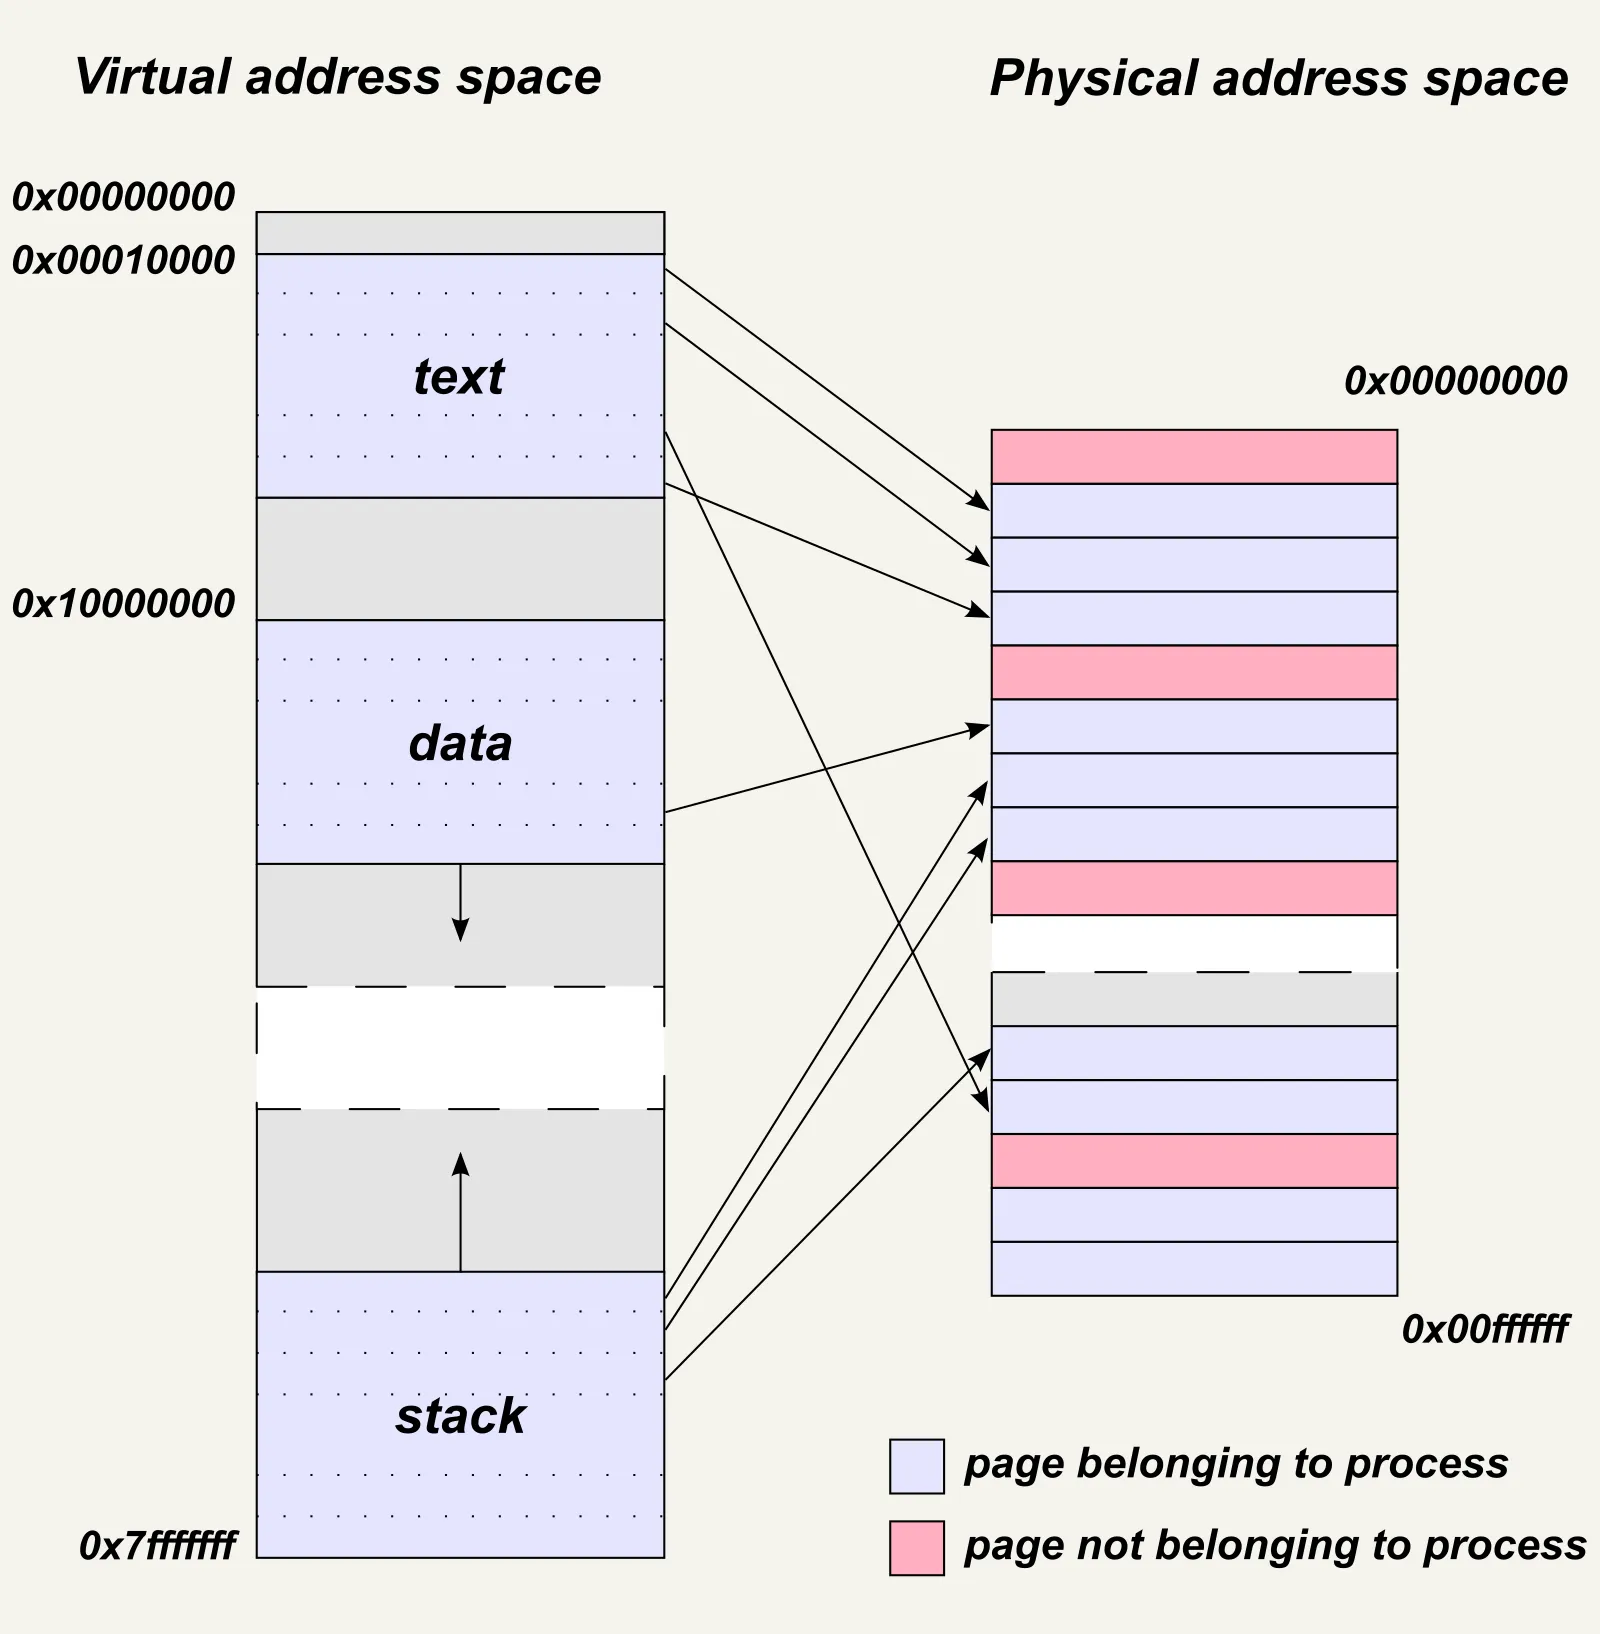
Source: Virtual address space and physical address space relationship, traced by User:Stannered from an original by User:Dysprosia, via Wikimedia Commons, BSD licence. The diagram uses 32-bit addresses, but the relationship it shows is exactly the one iOS uses today.
Here is the vocabulary you need, and it is worth being precise, because these words get used interchangeably in bug threads and they mean genuinely different things.
A page is the unit the memory system works in. Not bytes, pages. On modern Apple silicon devices a page is typically 16 KB, and the jetsam report will tell you the exact size rather than making you guess.
A virtual address space is the fake, private, enormous address range your process sees. Your app believes it owns a contiguous run of addresses starting near zero. It does not. Nobody does.
Physical memory is the actual RAM soldered onto the device. It is small, shared, and the only thing that is genuinely scarce.
A page table is the mapping between the two, maintained by the kernel and consulted by the hardware. When your code reads an address, the CPU needs the physical location for it. In the common case that translation is already cached in the translation lookaside buffer, or TLB, and costs essentially nothing. On a TLB miss the hardware walks the page table to find it. If there is no valid mapping at all, the hardware raises a fault and the kernel decides what to do about it.
Resident memory is the subset of your virtual pages that currently occupy physical RAM. This is the part that costs something.
File-backed pages are pages whose contents also exist in a file on disk, which describes your executable, the system frameworks, and anything you memory-map. They matter enormously, and we will come back to why.
So far this is standard operating system material, and it applies to macOS and iOS equally. The interesting part is where the two diverge.
Where the desktop assumptions stop working
On a Mac, when RAM runs low, the kernel has an escape hatch. It takes pages that have not been touched in a while and writes them out to disk, freeing the physical RAM for someone else. If the process touches those addresses again, the hardware faults, the kernel reads the page back, and the process never knows anything happened. It just runs slower. This is swapping, and it is why a Mac with 8 GB of RAM can run 30 GB of applications badly rather than not at all.
OS X Mavericks in 2013 added a smarter layer in front of that. Instead of going straight to disk, the kernel takes the least recently used pages and compresses them in place, typically getting them down to roughly half their size. Compressing and decompressing in RAM is far quicker than a round trip to storage, so the machine gets an effective capacity increase for the price of some CPU. Mavericks also replaced “how much memory is free” with memory pressure as the headline metric in Activity Monitor, which was the right call, because free memory is a nearly useless number on a healthy system.
Now, the part that trips up nearly everyone coming from desktop development, and the part where a lot of widely repeated folklore is out of date.
The folklore says iPhone has no swap at all, so dirty pages have nowhere to go, so termination is the only option. That was a reasonable summary a decade ago. It is not what modern XNU does, and the real picture is more interesting.
What iPhone does not have is macOS-style general-purpose swap for actively running processes. Your app, while it is in the foreground doing work, cannot count on the kernel quietly relocating its dirty pages to storage the way a Mac would. That much of the folklore survives, and it is the part that shapes how you write code.
But there are three real reclamation mechanisms underneath that, and they matter.
Compression. iOS compresses. Apple’s documentation on low-memory warnings states plainly that “iOS compresses memory pages that apps haven’t accessed recently.” Compressed pages still belong to your process and still count against your footprint, but they occupy less physical RAM.
The freezer. XNU’s own documentation opens by describing the freezer as “a limited form of swap on embedded.” Under memory pressure the freezer picks eligible suspended apps, compresses all of their dirty memory into a contiguous run of compressor segments, and hands those segments to a swapout thread that writes them to storage. The frozen app is then moved to jetsam band 75, specifically so that it is protected from termination. When the user comes back to it, the pages are faulted in from storage on demand, exactly as they would be on a Mac.
The freezer operates under real constraints, which is why it is a limited form of swap rather than a general one. Only suspended apps are eligible. Candidates are picked from the idle band in least-recently-used order. NAND has a finite write endurance, so the freezer works against a daily write budget supplied by the storage layer, and there is a cap on how many processes can be frozen at once. Frozen processes are demoted back towards the idle band over time to make room for others, a couple per day on iPhone.
App swap. Supported M-series iPads go further and have broader app swap, which is part of how Stage Manager runs several demanding apps at once. On those devices the freezer also runs far more aggressively, and there is an entire jetsam reason, low-swap, that exists for when swap space itself runs out.
So the accurate statement is this. Jetsam is what happens when reclaiming clean pages, purging, compressing, freezing and swapping cannot free enough memory in time. It is the bottom of a stack of mechanisms, not the only mechanism. It remains necessary because none of those other levers is unbounded. Compression costs CPU and eventually runs out of space of its own. The freezer only takes suspended apps and only within its write budget. App swap is not on every device, and can itself be exhausted.
That is still bad news for a foreground app holding 1.4 GB. Clean-page reclamation, purging and compression all still apply to a running process, and they may well have been working on your behalf. Freezing is the one mechanism that cannot help you there, since only suspended apps are eligible. The problem is that a footprint that large is mostly dirty anonymous memory, and none of the mechanisms that do apply is likely to free enough of it, fast enough, to rescue you. Which of them actually ran before the kill depends on what the kernel found when it checked, so do not assume the full list executed in order.
Allocating memory is not the same as using it
This is the single most useful idea in this article, so it gets its own section and its own diagram.
When developers say “my app uses 400 MB”, they are usually quoting a number they have not identified. There are at least four different quantities in play, and they can differ by orders of magnitude.
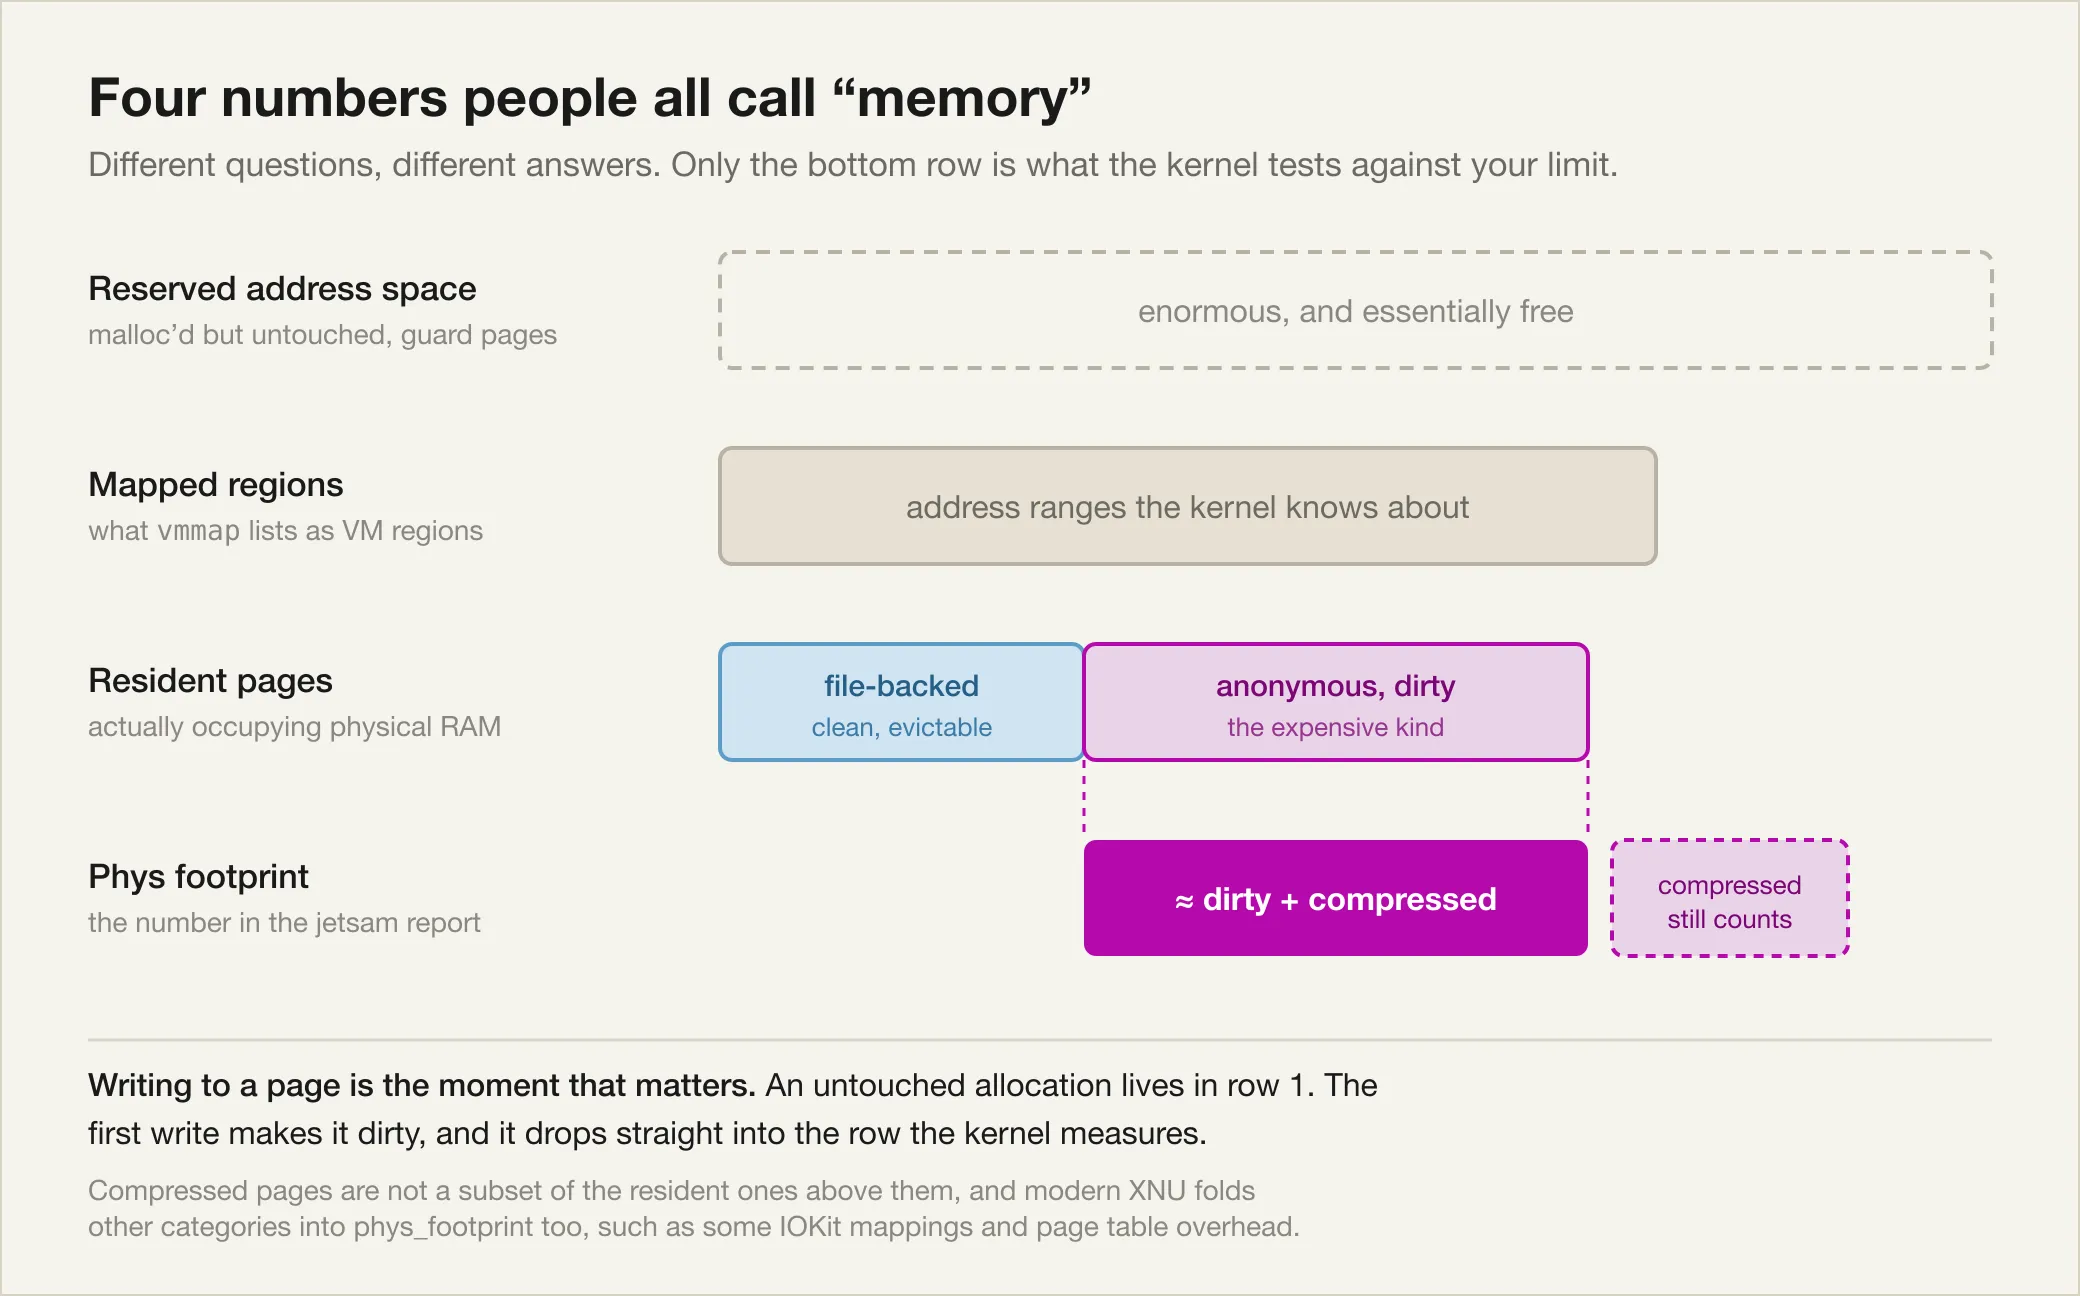
Reserved address space is what you get from an allocation call before you have done anything with the result. It is cheap almost to the point of being free. You can reserve gigabytes of address space on a device that has nowhere near that much RAM, and nothing bad happens, because you have asked for names rather than for things.
Mapped regions are the address ranges the kernel is actually tracking on your behalf. This is what vmmap prints.
Resident pages are the ones sitting in physical RAM right now. Getting closer, but still not the number that matters.
Physical footprint is the number that matters. As a working approximation it is your dirty pages plus your compressed pages, and it is the one the kernel tests against your limit. Treat that as a useful rule of thumb rather than the complete ledger. phys_footprint is a kernel accounting field, and modern XNU folds in more than those two categories, including things like certain IOKit mappings and page table overhead. The approximation is good enough to reason with and wrong enough that you should not try to reconcile it to the byte.
The word doing the work there is dirty. A page is dirty once you have written to it and the contents exist nowhere else. The kernel cannot simply discard a dirty page, because discarding it would destroy data. Its options are to compress the page, or, for an eligible suspended app, to freeze it out to storage. Both of those cost something and neither is unbounded, which is why dirty pages are the expensive kind. A dirty page is a page the system has to keep accounted for somewhere until your process gives it up or stops existing.
Compare that with a clean page, which is one whose contents can be reconstructed from somewhere else, almost always a file on disk. Your app binary, the system frameworks, a memory-mapped asset file, all clean, all file-backed. Under pressure the kernel can simply drop these and read them back later. Clean pages are borrowed. Dirty pages are owed.
This is why the moment of the first write is the interesting one, not the moment of allocation.
Apple documents this precisely in the header for os_proc_available_memory, which is the most direct answer iOS will give you about where you stand:
Return the number of bytes remaining, at the time of the call, before the current process will hit its current dirty memory limit.
…
Dirty memory contains data that must be kept in RAM (or the equivalent) even when unused. It is memory that has been modified.
Note the word “dirty” sitting in an API about how much room you have left. That is the whole model in one sentence.
Watch it happen
You do not have to take this on faith. Here is a small experiment you can drop into a real app on a real device. The physical device part matters. The Simulator runs the process under macOS, which does not impose an iOS jetsam limit, so os_proc_available_memory() can return zero there and the experiment tells you nothing about device headroom.
import os

func availableMiB() -> Double {
    Double(os_proc_available_memory()) / 1_048_576
}

let byteCount = 256 * 1024 * 1024   // 256 MiB

print("baseline:            \(availableMiB()) MiB free")

let buffer = UnsafeMutableRawPointer.allocate(
    byteCount: byteCount,
    alignment: 4096
)
print("after allocating:    \(availableMiB()) MiB free")

// Touch one byte in every page. 16 KB stride on Apple silicon.
for offset in stride(from: 0, to: byteCount, by: 16 * 1024) {
    buffer.storeBytes(of: UInt8(1), toByteOffset: offset, as: UInt8.self)
}
print("after touching:      \(availableMiB()) MiB free")

buffer.deallocate()
print("after deallocating:  \(availableMiB()) MiB free")
Here is the console output from my iPhone 16 Pro. Reserving 256 MiB does not move the number at all. Touching one byte in each page reduces the reported headroom by about 256.2 MiB, consistent with dirtying the 256 MiB buffer. The buffer did not grow between those two lines. You simply made its reserved pages real.

Do not be surprised that the value printed immediately after deallocate() has not recovered yet. Returning storage to the allocator and seeing that change reflected in the process footprint are not necessarily synchronous. Xcode’s timeline captured the same run peaking at 269.1 MB, then settling back to an 11.6 MB footprint. That later drop is evidence that the backing pages were returned to the operating system and stopped contributing to the process footprint.
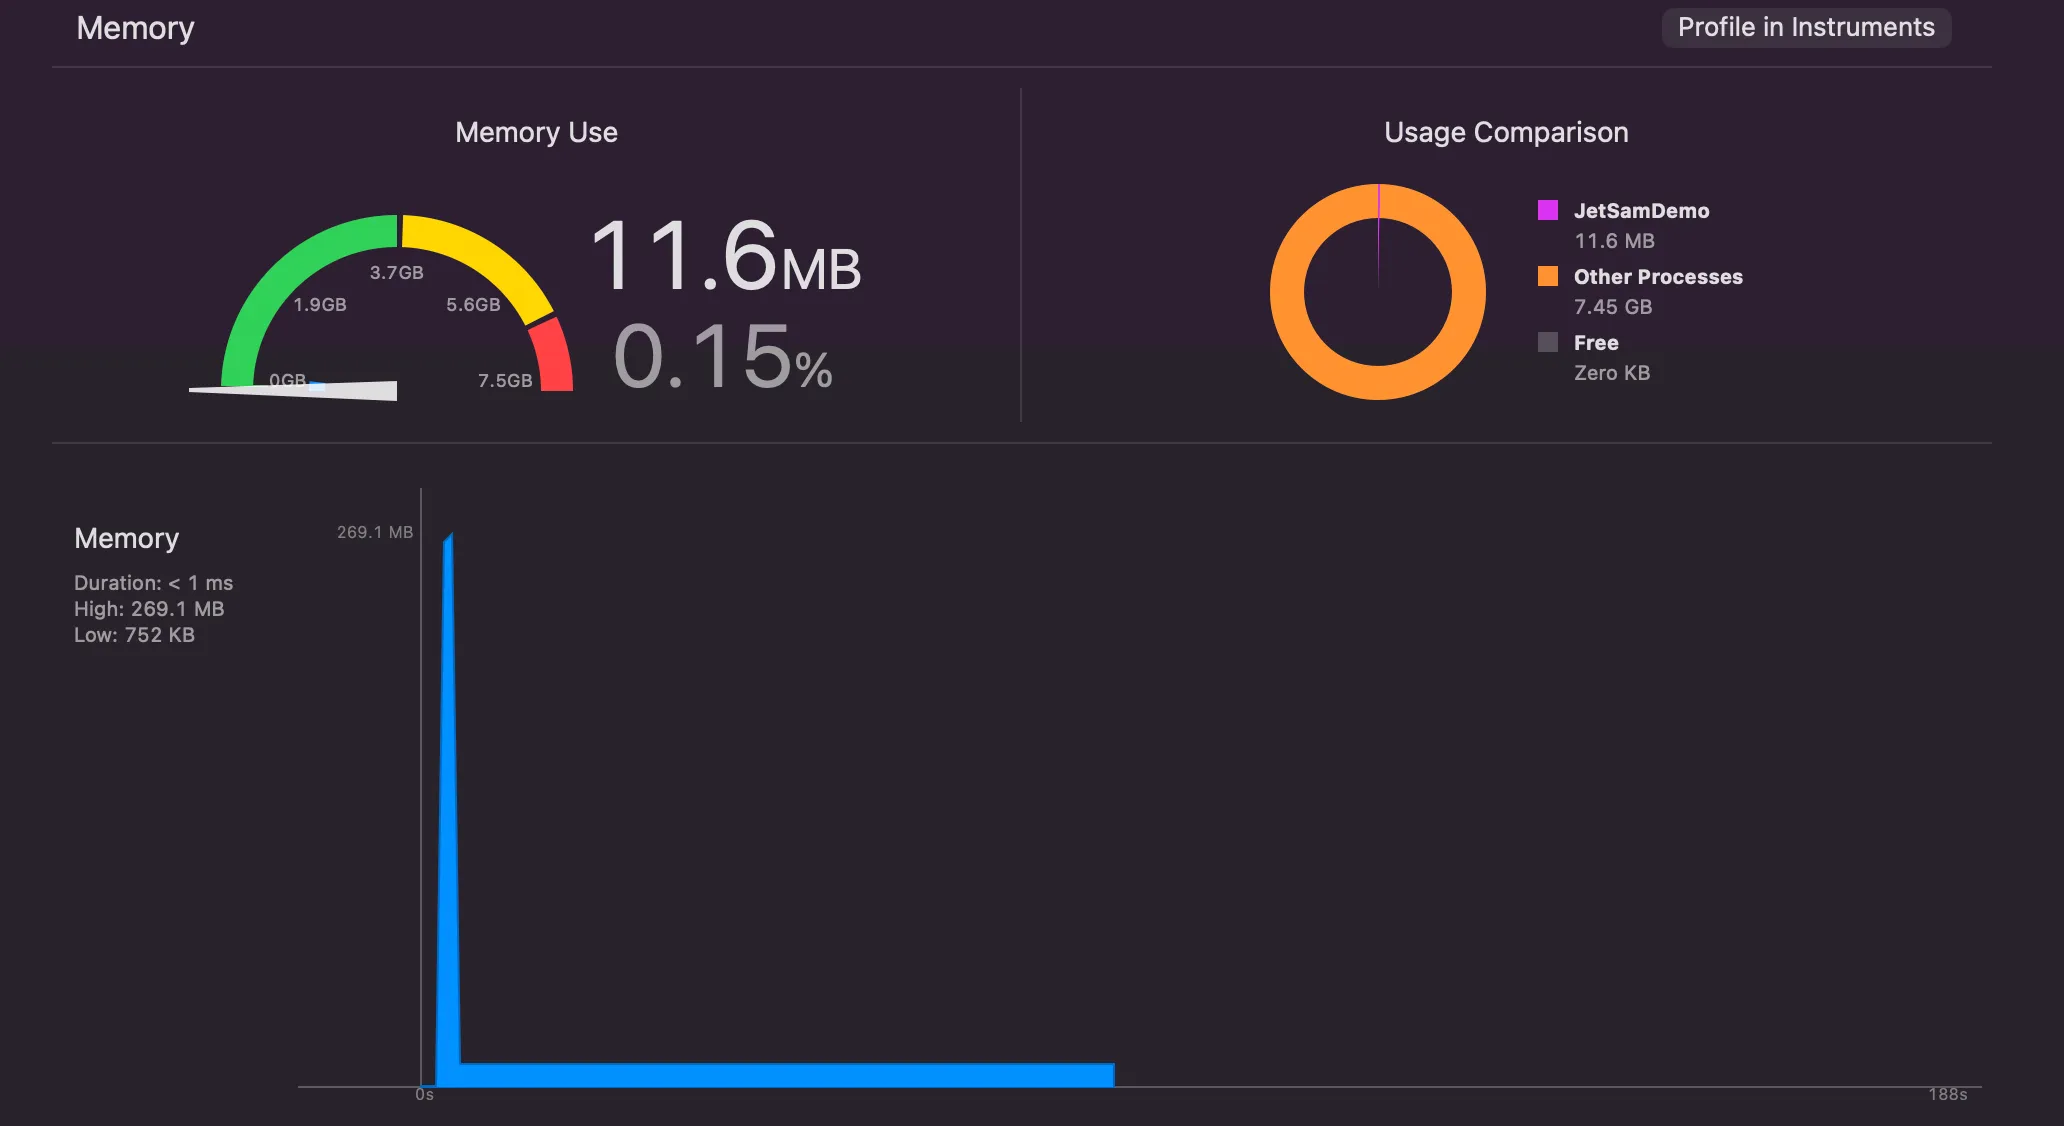
That experiment reports mebibytes, since dividing by 1,048,576 is the natural thing to do with a page-aligned buffer. The jetsam report arithmetic later in this article uses decimal MB and GB, to match how Apple presents the worked example in its own documentation. Both conventions are common, so the thing that matters is saying which one you are using.
If you want the raw footprint rather than the headroom, task_info gives you the same figure the kernel uses:
import Darwin

func physFootprintBytes() -> UInt64? {
    var info = task_vm_info_data_t()
    var count = mach_msg_type_number_t(
        MemoryLayout<task_vm_info_data_t>.size / MemoryLayout<natural_t>.size
    )

    let result = withUnsafeMutablePointer(to: &info) {
        $0.withMemoryRebound(to: integer_t.self, capacity: Int(count)) {
            task_info(mach_task_self_, task_flavor_t(TASK_VM_INFO), $0, &count)
        }
    }

    guard result == KERN_SUCCESS else { return nil }
    return info.phys_footprint
}
os_proc_available_memory() is the cheap call, and Apple documents it as equivalent to task_vm_info.limit_bytes_remaining. Use it freely. Do not cache the result, because it can be invalidated by another thread between you reading it and acting on it, and because your limit itself can change during the app lifecycle.
One caution that Apple puts directly in the header, and that is worth repeating. This API makes it easy to write code that consumes every byte available to you. Staying under your limit is not the same thing as being a good citizen. Significant memory use, even entirely legal memory use, pushes other processes closer to the edge and makes the whole device worse.
The tools disagree with each other, and that is fine
You will meet several ways to read these numbers and they will not match. That is expected, because they are measuring different things.
vmmap and footprint on the command line give you the region-by-region truth. You can only attach them to a live process on macOS or the Simulator, but vmmap also reads a .memgraph exported from Xcode with File > Export Memory Graph, including one captured from a real device, which is the best region-level view a device will give you. Xcode’s Memory Report gauge gives you a live approximation while debugging. Instruments Allocations tracks heap and anonymous VM allocations by category. The jetsam report gives you page counts as the kernel saw them at the moment of death.
Treat these as complementary views, not as interchangeable totals. If the Memory Report says 380 MB and footprint says 412 MB, neither of them is lying to you.
There is one trap here worth stating loudly, because Apple flags it too. The Simulator cannot validate your app against device jetsam limits. Apple notes that the memory gauge stays in the green region there, because macOS is not applying iOS memory limits or issuing out of memory terminations to Simulator processes. That is genuinely useful when you want to let a runaway workload keep running so you can inspect it, and you can still fire Debug > Simulate Memory Warning to exercise your handler. What you cannot do is conclude anything about device safety from a green gauge in the Simulator.
From Swift objects to Darwin pages
Now let us connect the language you write to the pages the kernel counts, because the gap between them causes a specific and very common confusion.
When you release the last strong reference to an object, ARC calls deinit and the allocator marks that block as free. That is where the Swift-level story ends. The operating system story does not necessarily change at all.
The allocator is holding a pool of pages it obtained from the kernel earlier. Freeing an object returns the block to that pool, not to the kernel. The allocator keeps the pages because asking the kernel for memory is expensive and it fully expects you to allocate something else in a moment. Those pages are still dirty. They still count against your footprint. From the kernel’s point of view, nothing happened.
So this is a completely normal sequence of events:
- You free 200 MB of objects.
- Instruments Allocations shows live bytes dropping by 200 MB.
- Your physical footprint does not move.
- Nothing is leaking.
ARC is not garbage collection, and it is also not the operating system’s page reclamation. These are three separate mechanisms, and conflating any two of them will send you hunting for bugs that are not there.
Several other things widen the same gap.
Fragmentation. A page cannot be returned unless everything on it is free. One surviving small object can hold a whole page hostage, so a heap that is 90% free by bytes can still be nearly 100% resident by pages.
Autorelease pools. Objects that come back from Foundation and other Objective-C APIs are often autoreleased, which means they are guaranteed to live until the pool drains. On the main thread the pool drains once per run loop iteration. If you run a tight loop that creates thousands of bridged temporaries, they all pile up until the loop finishes. Wrapping the body in autoreleasepool { } drains it each iteration and can flatten a peak dramatically.
Copy on write. Array, String, Data and Dictionary share storage until someone mutates. That is usually a win, but it means the moment a copy becomes real is not the line where you wrote =, it is the line where you first mutated. Peaks show up in surprising places.
Capacity versus count. A Swift Array grows its buffer geometrically. An array that reached 1,000,000 elements and was then filtered down to 10 may still hold the larger buffer. reserveCapacity helps when you know the size in advance, and building a fresh array helps when you have shrunk a lot.
A brief warning about all of the above. Allocator behaviour, pool sizes, and growth factors are implementation details. They change between OS releases without announcement, because they are not API. Use this knowledge to interpret what you observe, and never to write code that depends on a particular allocator’s habits.
The hidden cost of images
If you are debugging a real jetsam termination in a real app, there is a good chance images are involved. The reason is arithmetic.
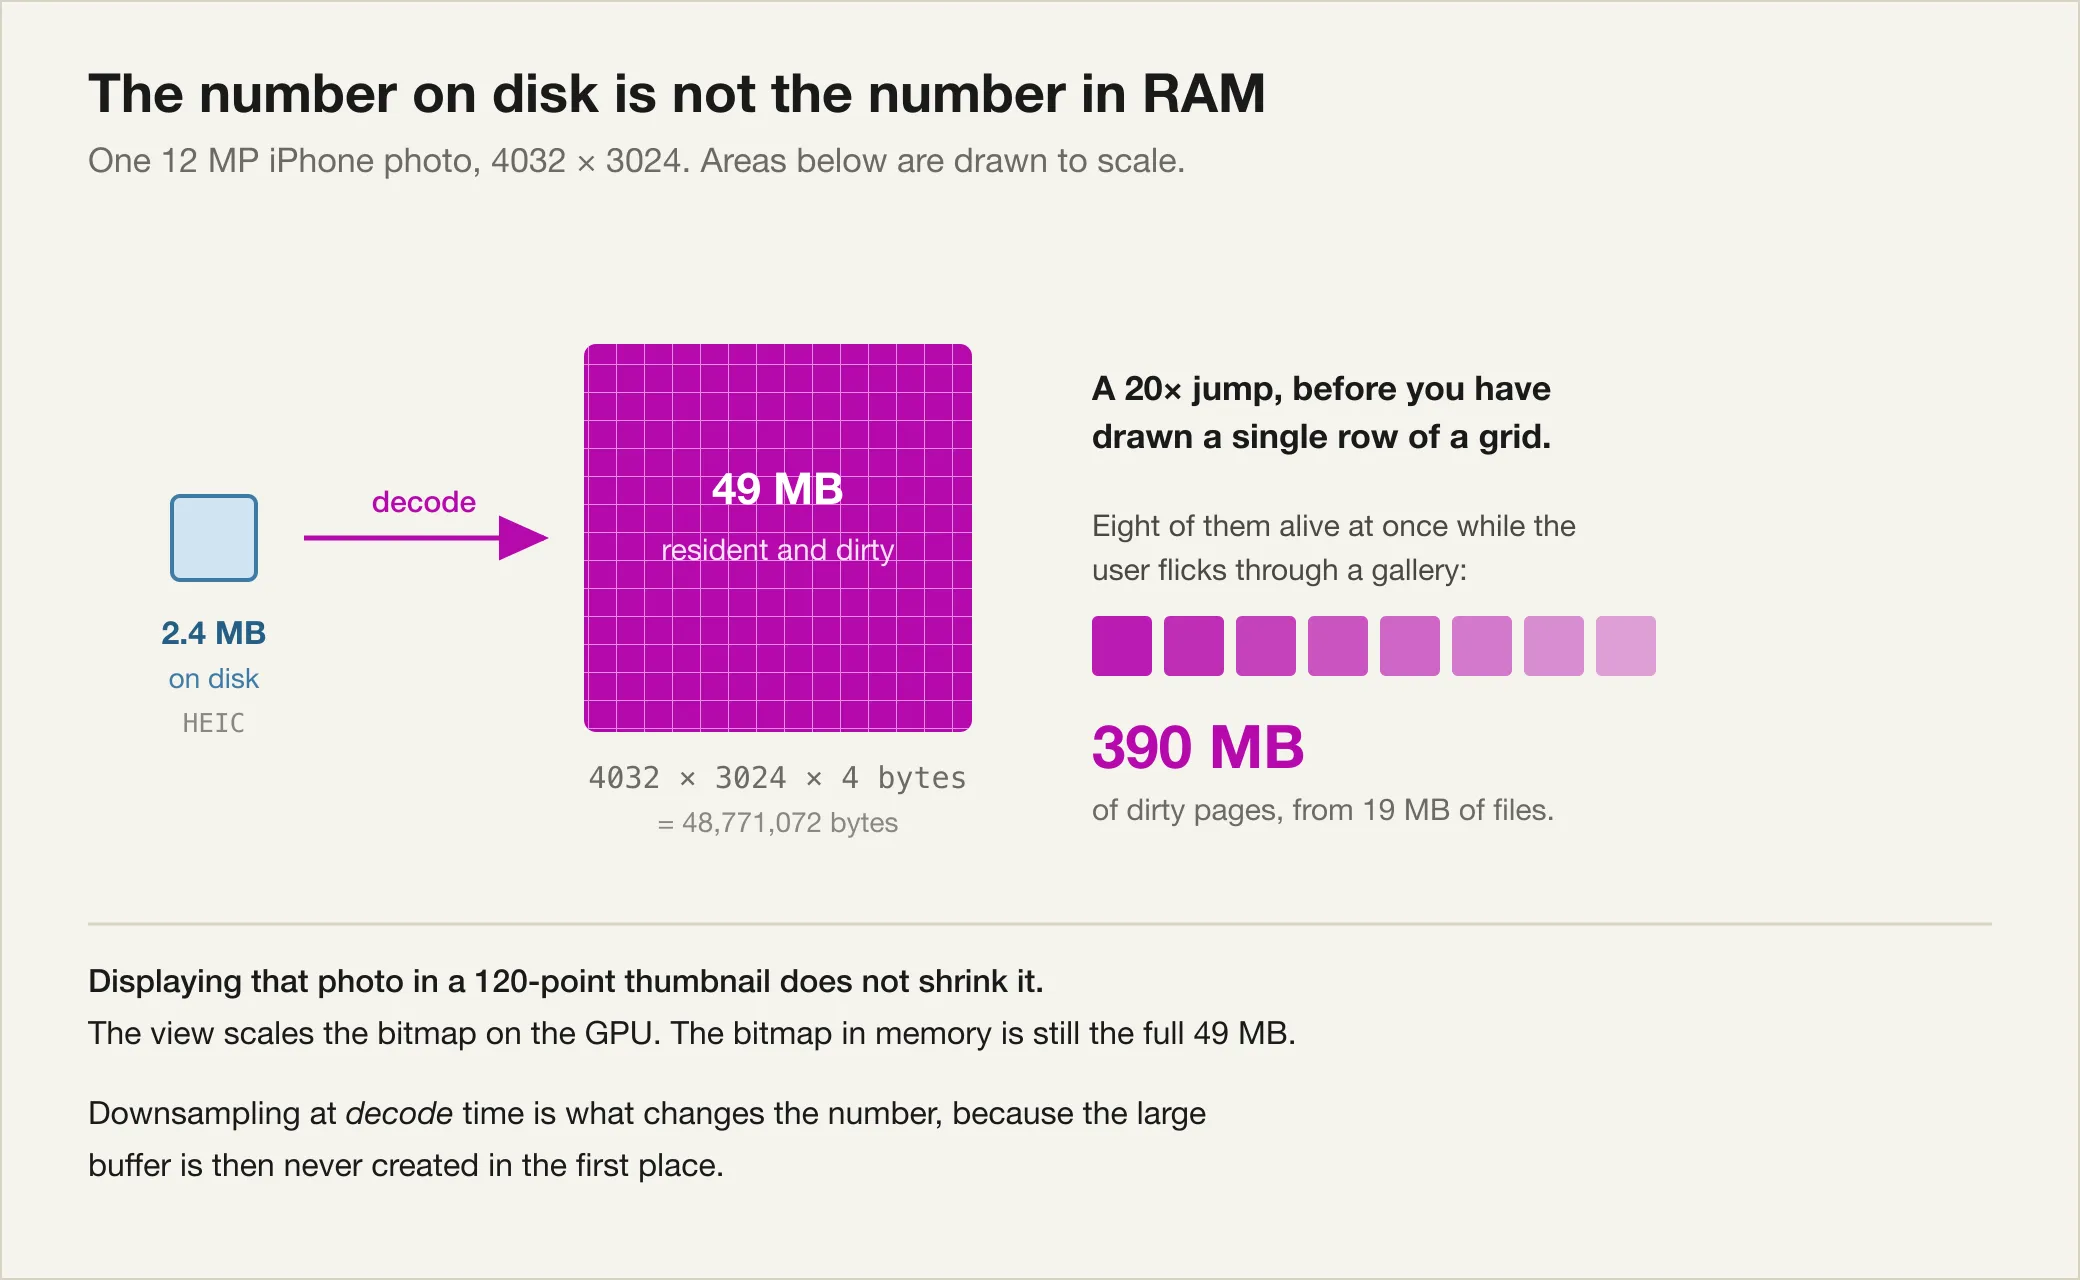
An image on disk is compressed. An image in memory, ready to draw, is not. It is a plain rectangular buffer of pixels, and its size is fixed by geometry alone:
width in pixels × height in pixels × bytes per pixelA 12 MP iPhone photo is 4032 by 3024. Current main cameras commonly shoot 24 MP, so treat this as a conservative example rather than a ceiling. At the usual 4 bytes per pixel for 8-bit RGBA:
4032 × 3024 × 4 = 48,771,072 bytes ≈ 49 MBThe file that photo came from might be 2.4 MB. The compression ratio on disk is doing tremendous work for you, and it does absolutely nothing for you once the image is decoded. That is a twentyfold jump the moment the bitmap materialises.
Now put eight of them on screen in a gallery, which is not an unusual thing for a gallery to do, and you are carrying about 390 MB of dirty pages that came from 19 MB of files.
Here is the part that surprises people. Displaying that photo in a small thumbnail does not make it smaller. If you hand a full resolution image to an image view sized at 120 points, the view scales it during compositing. The buffer in memory is still the whole 49 MB. You have made it look small without making it be small.
The fix is to downsample at decode time, so that the large buffer is never created at all. ImageIO does this properly, decoding straight to the size you asked for. The copy-paste implementation is in Downsample an Image in Swift. It accepts a file URL, the destination CGSize in points, and an explicit display scale.
With that function, the same 4032 by 3024 photo, decoded for a 120 point cell on a 3x screen, becomes 360 by 270 pixels, which is 388,800 bytes. That is roughly 0.8% of what you were holding before.
A few related costs hide in the same neighbourhood.
Backing stores. Every layer that rasterises, every shadow, every asynchronously drawn surface, is a bitmap with the same arithmetic. A full screen backing store on a large iPhone is more than ten megabytes on its own. 1290 by 2796 at 4 bytes per pixel is 14.4 MB, by exactly the arithmetic above.
Metal and GPU resources. Textures and buffers count too. Choose storage modes deliberately, and mark transient resources volatile when you can genuinely recreate them.
Caches you forgot were caches. NSCache will evict under pressure, which is exactly what you want. A Dictionary you are using as a cache will not evict anything, ever, because it does not know it is a cache. This is the most common accidental leak that is not a leak.
To reproduce this deliberately, build a scrolling grid backed by large images, run it on a device, and watch the Memory Report. Then switch the loading path to the linked downsampling function and watch the same scroll. The difference is not subtle.
What memory pressure actually means
Memory pressure is a property of the whole device, not of your app. This is the mental shift that makes jetsam reports readable.
The kernel has a toolbox of responses to a shortage, and it picks from that toolbox rather than marching through a fixed sequence. The tools are roughly these:
- Reclaim clean pages. Anything file-backed can be dropped and re-read later. This is nearly free and happens constantly.
- Purge purgeable memory. Data explicitly marked as volatile gets thrown away.
- Compress. Dirty pages get compressed in place, and the compressor pool gets compacted.
- Freeze, and swap where available. Eligible suspended apps get written out to storage, within a write budget. On app-swap devices, more can move.
- Notify. Processes receive memory pressure notifications, giving them a chance to cooperate.
- Terminate. A process is killed and everything it held is reclaimed at once.
It is tempting to draw that as a staircase where each step only happens after the one above it failed. Resist the temptation, because it is not how the kernel is built. XNU’s memorystatus subsystem is designed around a periodic health check. A thread is woken blindly whenever any monitored resource looks low, it evaluates the whole system state, and then it picks an action to fit what it found. Which action depends on which resource is short and by how much. Some kills are pre-emptive and happen on a system that is otherwise healthy. Some happen synchronously on whichever thread hit the limit, without the memorystatus thread being involved at all.
There is a second, sharper reason not to think of warnings as “the step before termination”, and it is the single most useful thing in this section.
Memory pressure notifications and jetsam are two separate control loops, watching two different numbers. XNU documents this explicitly. The pressure level that drives notifications is computed from one measure of available memory, and jetsam makes its decisions from a different one, memorystatus_available_pages, which counts only fully reclaimable pages and compares them against total memory. The two have different thresholds and different design goals. Jetsam is trying to keep a modest pool of instantly reclaimable pages on hand for demand spikes. The pressure loop is trying to keep the working set of all running processes resident.
The practical consequences are worth stating plainly. You can receive a warning and never be terminated. You can be terminated having received no warning at all. And a suspended app is not running, so it cannot act on a notification even if one is sent.
Your app can observe the pressure level through several channels:
applicationDidReceiveMemoryWarning(_:)on your app delegatedidReceiveMemoryWarning()on active view controllers- the
didReceiveMemoryWarningNotificationnotification - a dispatch source of type
DISPATCH_SOURCE_TYPE_MEMORYPRESSURE, which reportsNORMAL,WARNorCRITICAL
What you cannot do is watch termination approach. There is a kernel-internal pressure level that fires when jetsam is nearing the foreground band, and it is deliberately not subscribable from your process. Apple is also explicit that the warnings you do get are best effort. If demand rises faster than warnings can relieve it, the system does not have time to send them and wait politely. So a memory warning handler is worth having, and it is not a safety net, and it is certainly not an early warning system for your own death.
Two pieces of guidance here are easy to get backwards, and Apple calls both of them out directly.
Do not walk your whole object graph looking for things to release when a warning arrives. iOS has been quietly compressing your idle pages. Touching every object to see whether you can free it pulls all of those pages back out of the compressor, which increases memory demand at the exact moment the system is asking you to reduce it. Free the things you already know are disposable, and stop.
And if you have data you can cheaply recreate, NSPurgeableData lets the kernel discard it for you without waiting for your notification handler to run at all. Apple also advises against using NSPurgeableData in connection with NSCache, without giving a reason, so take that one as a straight instruction rather than something to reason about.
Because pressure is system-wide, your app can be terminated in a situation it played no part in creating. Someone opened the camera. A background upload spiked. Another app leaked. Your process was sitting there, suspended, holding 300 MB, and that made you the cheapest way for the kernel to solve its problem.
Which brings us to how it picks.
How jetsam chooses
Every process on the device sits in a numbered priority band. The numbers are not secret. They are constants in XNU’s kern_memorystatus.h, which Apple publishes.
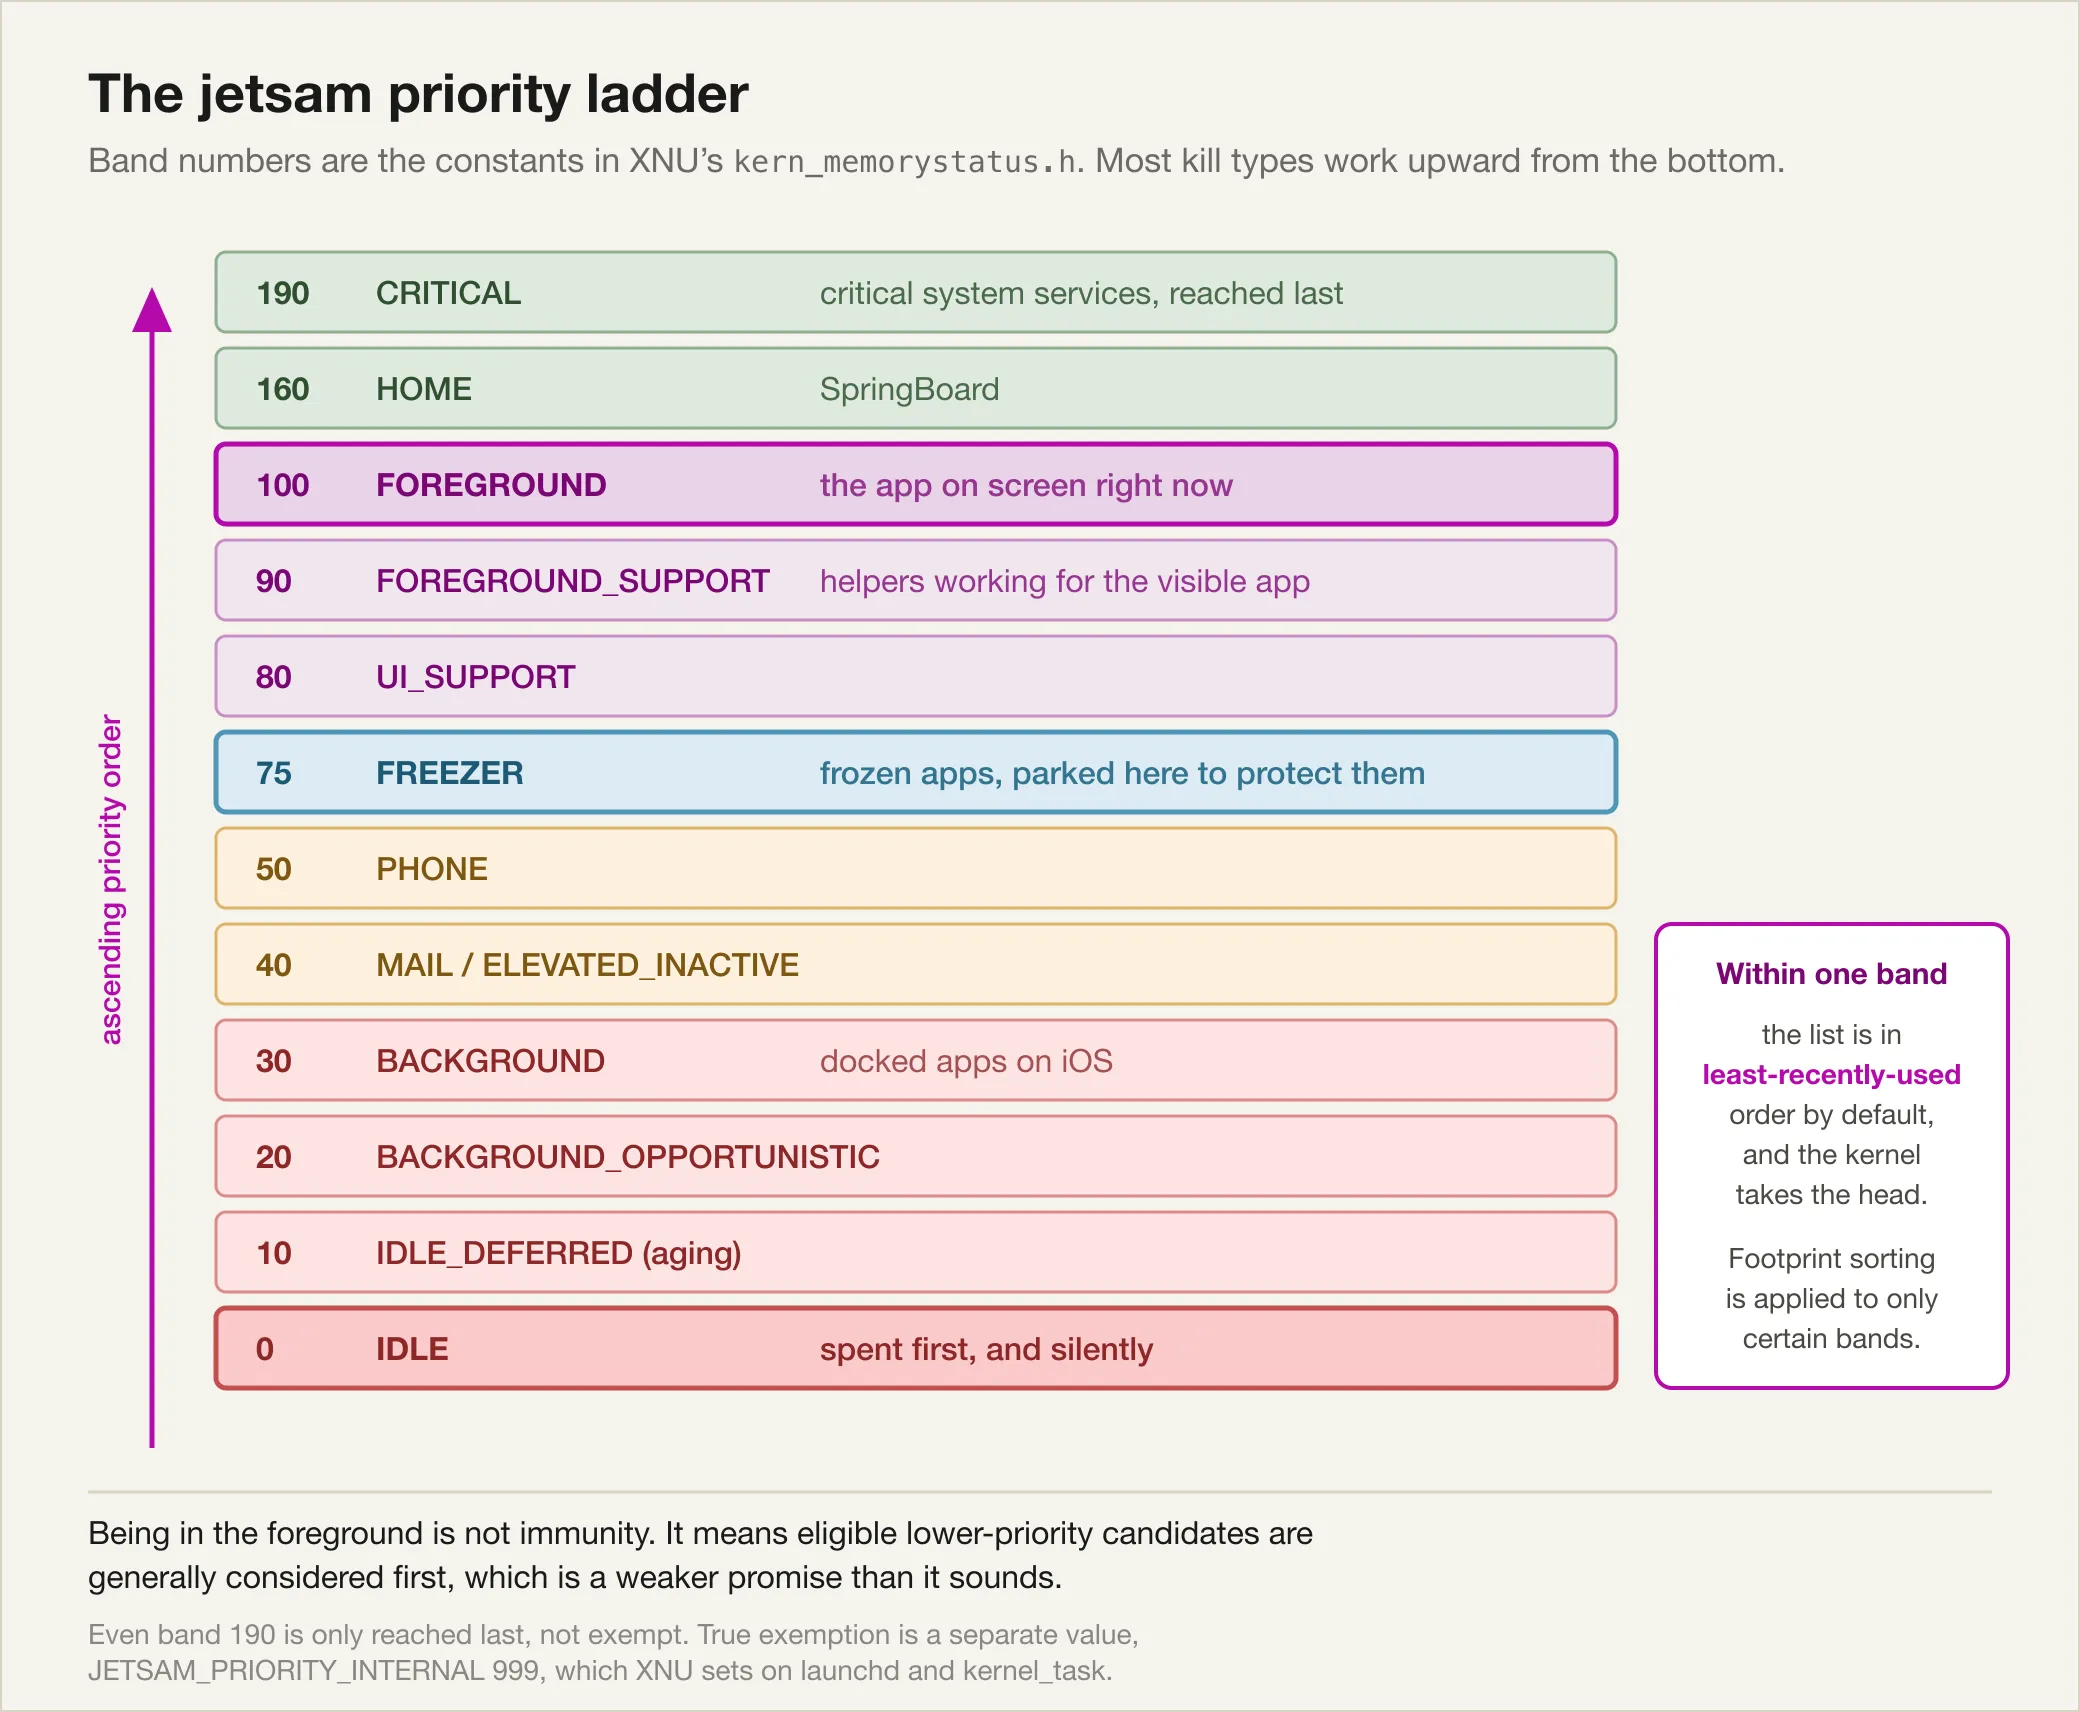
Band values from bsd/sys/kern_memorystatus.h in Apple’s open source XNU distribution.
Many kill types work in ascending jetsam priority order, so lower bands are generally considered before higher ones. The kernel kills a process, then re-checks whether that was enough before continuing, so bands are not so much emptied as spent. There are more bands than the named ones, since 1 through 9 are reserved for entitled processes and there is an aging band at 15. Not every kill type marches up the bands, either. Some target a single process and stop.
A high band is not the same as immunity. Even band 190 only means the kernel gets there last. XNU reserves a separate value for processes it will not consider at all, JETSAM_PRIORITY_INTERNAL at 999, described in the header as “so high priority it is not processed by jetsam at all” and set on launchd and kernel_task. Nothing you ship goes there.
Where your app sits is decided outside the kernel, and it is not a simple function of what the user just did. For managed processes, RunningBoard asserts the band based on the assertions the app currently holds. On screen you are in the foreground band at 100. Once you are suspended you are usually heading towards the idle band at 0, and if the freezer takes you, you land in band 75 instead.
Band 30 is a good example of why you should not treat this as contractual. It is tempting to read JETSAM_PRIORITY_BACKGROUND as “every app the user swiped away”, and that is wrong. On iOS, XNU documents band 30 as holding docked apps, a set that a system daemon maintains for applications the user is likely to return to. Being docked is a privilege rather than a default, and it has knock-on effects. Docked apps are not in the idle band, so they are not freezer candidates. Do not build a mental model where a specific user action maps to a specific band number.
Within a single band, size matters, but it is not the standing invariant that most write-ups claim. XNU keeps each band as a list in least-recently-used order and takes from the head. Before a kill sweep it may re-sort a band by footprint using memstat_sort_by_footprint_locked, a selection sort that hoists the largest process to the front, but it only does this for specific bands, and the foreground band’s sort order is a boot tunable. On iOS that tunable currently defaults to LRU rather than footprint:
#define JETSAM_SORT_IDLE_DEFAULT JETSAM_SORT_FOOTPRINT_NOCOAL
#if XNU_TARGET_OS_IOS && !XNU_TARGET_OS_XR
#define JETSAM_SORT_FG_DEFAULT JETSAM_SORT_LRU
#else
#define JETSAM_SORT_FG_DEFAULT JETSAM_SORT_FOOTPRINT
#endif
A coalition pass then reorders members again, so that a coalition’s leader dies after its XPC services and extensions rather than before them.
So the honest rule, in one sentence: the kernel selects an eligible process according to the ordering that the kill policy for that particular shortage specifies, which for most kill types means working up from the lowest occupied band, and within a band taking from the head of a list that is least-recently-used by default, footprint-sorted only where the kernel chooses to sort, and reordered once more by coalition role.
That is a mouthful, and it is deliberately not a formula. Size is a strong influence on who dies. It is not a guarantee, and you should be suspicious of any article that tells you it is.
Still, it explains a lot of otherwise baffling production behaviour.
It explains why your app dies while backgrounded and you never see a warning, because suspended processes are not running to receive one. It explains why the app that gets killed is often not the app that caused the shortage. And it explains why “but we were in the foreground” is not a defence. Foreground is band 100, not immunity. It means eligible lower-priority candidates are generally considered before you, which is a very different promise from a guarantee that every one of them is gone first.
The documented reasons
When a process is jettisoned, the report records why. These are the values Apple documents.
per-process-limit means the process crossed the resident memory limit the system imposes on it. This one is about you specifically. Your footprint went over your own ceiling, and nobody else was involved.
vm-pageshortage means the system was under memory pressure and needed to free background memory for the foreground app. This one is about the device, and you were the most convenient donor.
vnode-limit means too many files were open across the whole system. Vnodes are the kernel structures backing open files and they are finite. Note that the system may kill your background app to free vnodes even if your app is not the one leaking them.
fc-thrashing means a process was thrashing the system file cache by reading and writing non-sequential parts of memory-mapped files too often. The same collateral damage caveat applies.
highwater means a process exceeded its highest-expected memory footprint. Apple describes this one in terms of system daemons, and that is where you will usually see it, but the underlying kernel cause is the generic “crossed its own high-water limit” kill. Do not assume the key can never land on your process.
jettisoned means the generic kill, with no more specific cause recorded. Not helpful, but honest.
One caveat on that list. It is the documented set, not the exhaustive one. XNU’s memstat_kill_cause_name[] in bsd/kern/kern_memorystatus.c carries around seventeen strings, so you may occasionally meet an undocumented one such as vm-compressor-thrashing, sustained-memory-pressure or low-swap. Treat anything in that family the way you would treat vm-pageshortage. The device was short, and you were expensive.
The first two are the ones you will actually meet, and telling them apart is the single most valuable thing a jetsam report gives you, because they lead to completely different fixes.
A note on extensions
App extensions get a much lower memory limit than foreground apps. Apple says so directly, and warns against putting high-baseline technologies inside them. A share extension, a notification service extension, or a widget is a separate process with a separate and considerably tighter budget.
The practical consequence is that code which is perfectly safe in your app can be fatal when you move it into an extension, unchanged. If your extension needs a map, an MKMapSnapshotter image costs far less than a live MKMapView. Test extensions against their own budget, never against the host app’s.
And please resist the temptation to publish a table of “the iOS memory limit” per device. Those numbers vary by device, by OS version, by whether you are foreground or background, and by process type. Query os_proc_available_memory() at runtime instead of hardcoding folklore.
Reading a jetsam event report, line by line
You find these on your iPhone under Settings > Privacy & Security > Analytics & Improvements > Analytics Data. Look for a log whose name starts with JetsamEvent, then share it to yourself.
Thanks to modern AI tools, you do not have to do every pass by hand. After removing identifiers and anything else sensitive, you can give the report to an AI agent and ask it to identify the killed process, convert page counts, and explain the reason. That is genuinely useful. It is still worth understanding the keys yourself, because the difference between rpages, lifetimeMax, reason, and largestProcess is the difference between a useful diagnosis and a confident guess.
One thing to know before you go hunting, because it is exactly the trap this article opened with. Jetsam events do not appear in Xcode’s Crashes organizer. Apple lists them explicitly among the report types the organizer does not carry, alongside watchdog events and thermal events. So an empty organizer is not evidence that your app was not jettisoned. It is evidence of nothing at all.
Here is a synthetic report, constructed for this article rather than captured from a device, using the field names and shapes Apple documents. Read it as a worked example, not as evidence about any real app. The scenario is a photo browsing app that had been pushed to the background while the user took a few pictures.
{
  "crashReporterKey" : "9f2c1d0b7e4a55c8d1f3b6a90e2c47d5183f6b2a",
  "product" : "iPhone14,3",
  "incident" : "6D1A9F02-73C4-4E1B-9A88-2F5C0D3E7B41",
  "date" : "2026-08-19 14:22:07.31 +0700",
  "build" : "iPhone OS 26.1 (23B81)",
  "memoryStatus" : {
    "compressorSize" : 118422,
    "compressions" : 84713920,
    "decompressions" : 51230118,
    "zoneMapCap" : 1610612736,
    "largestZone" : "APFS_4K_OBJS",
    "largestZoneSize" : 41582592,
    "pageSize" : 16384,
    "uncompressed" : 231044,
    "zoneMapSize" : 700448768
  },
  "largestProcess" : "Lumen",
  "genCounter" : 0,
  "processes" : [
    {
      "uuid" : "5e1c9a44-2f77-4c0b-b3a1-9d8e6f204c17",
      "states" : [ "frontmost" ],
      "lifetimeMax" : 24610,
      "purgeable" : 0,
      "fds" : 212,
      "coalition" : 812,
      "rpages" : 24188,
      "pid" : 1204,
      "name" : "Camera"
    },
    {
      "uuid" : "b7d3f018-6c25-4a9e-8f10-33ab5e7c2d94",
      "states" : [ "suspended" ],
      "lifetimeMax" : 88102,
      "purgeable" : 4096,
      "fds" : 341,
      "coalition" : 774,
      "rpages" : 87431,
      "reason" : "vm-pageshortage",
      "pid" : 1187,
      "name" : "Lumen"
    },
    {
      "uuid" : "c9a2e551-8b04-41d7-96f2-7e0d15b8a3c6",
      "states" : [ "daemon" ],
      "lifetimeMax" : 9204,
      "purgeable" : 0,
      "fds" : 96,
      "coalition" : 12,
      "rpages" : 8873,
      "pid" : 214,
      "name" : "mediaserverd"
    }
  ]
}
Read it in this order.
Step one, get the page size. Look in memoryStatus for pageSize. Here it is 16384, which is 16 KB. Every page count in this file is meaningless until you have this number.
Step two, find the reason. Search the whole document for "reason". Only the jettisoned process carries that key. Here it appears exactly once, on Lumen.
This step is your first real fork in the road. If the process with the reason key is not your app, then your app was not jettisoned, and whatever made it disappear is a different problem entirely. Go and find its crash report instead. A surprising number of investigations end right here, correctly.
Step three, convert pages to bytes. Take the jettisoned process’s rpages and multiply by pageSize.
Despite the name, rpages is not the “resident pages” bar from the diagram earlier. XNU fills it from the task’s phys_footprint divided by the page size, so it is the bottom bar, the same quantity os_proc_available_memory() is measured against. The name is a historical leftover, and it is the single most misleading identifier in the whole format.
87,431 pages × 16,384 bytes = 1,432,469,504 bytes ≈ 1.43 GBThat is what Lumen was holding when it died. For a photo app that has been backgrounded, 1.43 GB is a lot to still be carrying. The report tells you the size. It does not tell you what the bytes were, so “it never released its decoded image cache” is a hypothesis to go and test in Instruments, not something the report has established.
Step four, read lifetimeMax. This is the highest page count the process reached over its lifetime, not just its value at death. Here it is 88,102 pages, about 1.44 GB, which is barely above rpages.
Be careful about what that does and does not prove. It tells you the process died close to its own lifetime maximum, so it was not caught midway down from a much larger spike. It does not tell you the shape of the curve in between. Two numbers cannot establish that the app sat flat at 1.4 GB for the whole time it was suspended, and a suspended process is not allocating anyway. If you want the trajectory, you need sampling over time, not a single snapshot. A large gap between lifetimeMax and rpages is more informative in the other direction, since it does tell you a peak had receded before the end.
Step five, read states. Lumen was suspended. It was not running, so it could not have acted on a memory pressure notification even if one had been sent, and it had no opportunity to defend itself.
Put that together with vm-pageshortage and with largestProcess and you have a coherent, well-supported hypothesis. The device came under pressure while Camera was frontmost, and a large suspended app was reclaimed. What you do not have is proof of the selection rule. The report records the outcome, not the kernel’s reasoning, and as the previous section showed, size is an influence on that decision rather than the whole of it.
Step six, check largestProcess. This names the biggest memory consumer on the whole device at that moment. Here it is Lumen, which is the strongest single piece of evidence in the file. Apple’s guidance is direct on this point. If other apps are regularly being jettisoned and your app is the largestProcess, you should reduce your memory use to cooperate better, even when you are not the process being killed.
Step seven, note the supporting fields. uuid is the binary’s build UUID, which you match against your dSYMs to know exactly which build this was. coalition groups your app with processes doing work on its behalf, including your own extensions, so you can spot a widget or a share extension inflating your effective total.
purgeable reports the process’s purgeable memory, and like rpages and lifetimeMax it is a page count, not bytes. Here 4,096 pages works out to about 67 MB.
Resist the urge to just subtract that from the footprint. Purgeable memory is a marking scheme with states, and only ranges currently marked volatile are ones the kernel may reclaim at will. Non-volatile purgeable memory is ordinary memory that happens to live in a purgeable object. So 67 MB is an upper bound on what might have been cheap to reclaim, not a discount you can apply to the total.
The verdict
For this report, the reason is vm-pageshortage and not per-process-limit, and that distinction determines where you look next. Lumen never exceeded its own ceiling. It was reclaimed while the device was short, and it was carrying more than anything else on the device at the time.
So the leading hypothesis is not “find the leak”. It is “we retain too much while suspended”. Those are very different tickets, and picking the wrong one costs you a week. The report is enough to rank the hypotheses. Confirming which one is right is a job for Instruments and for MetricKit across your real user base.
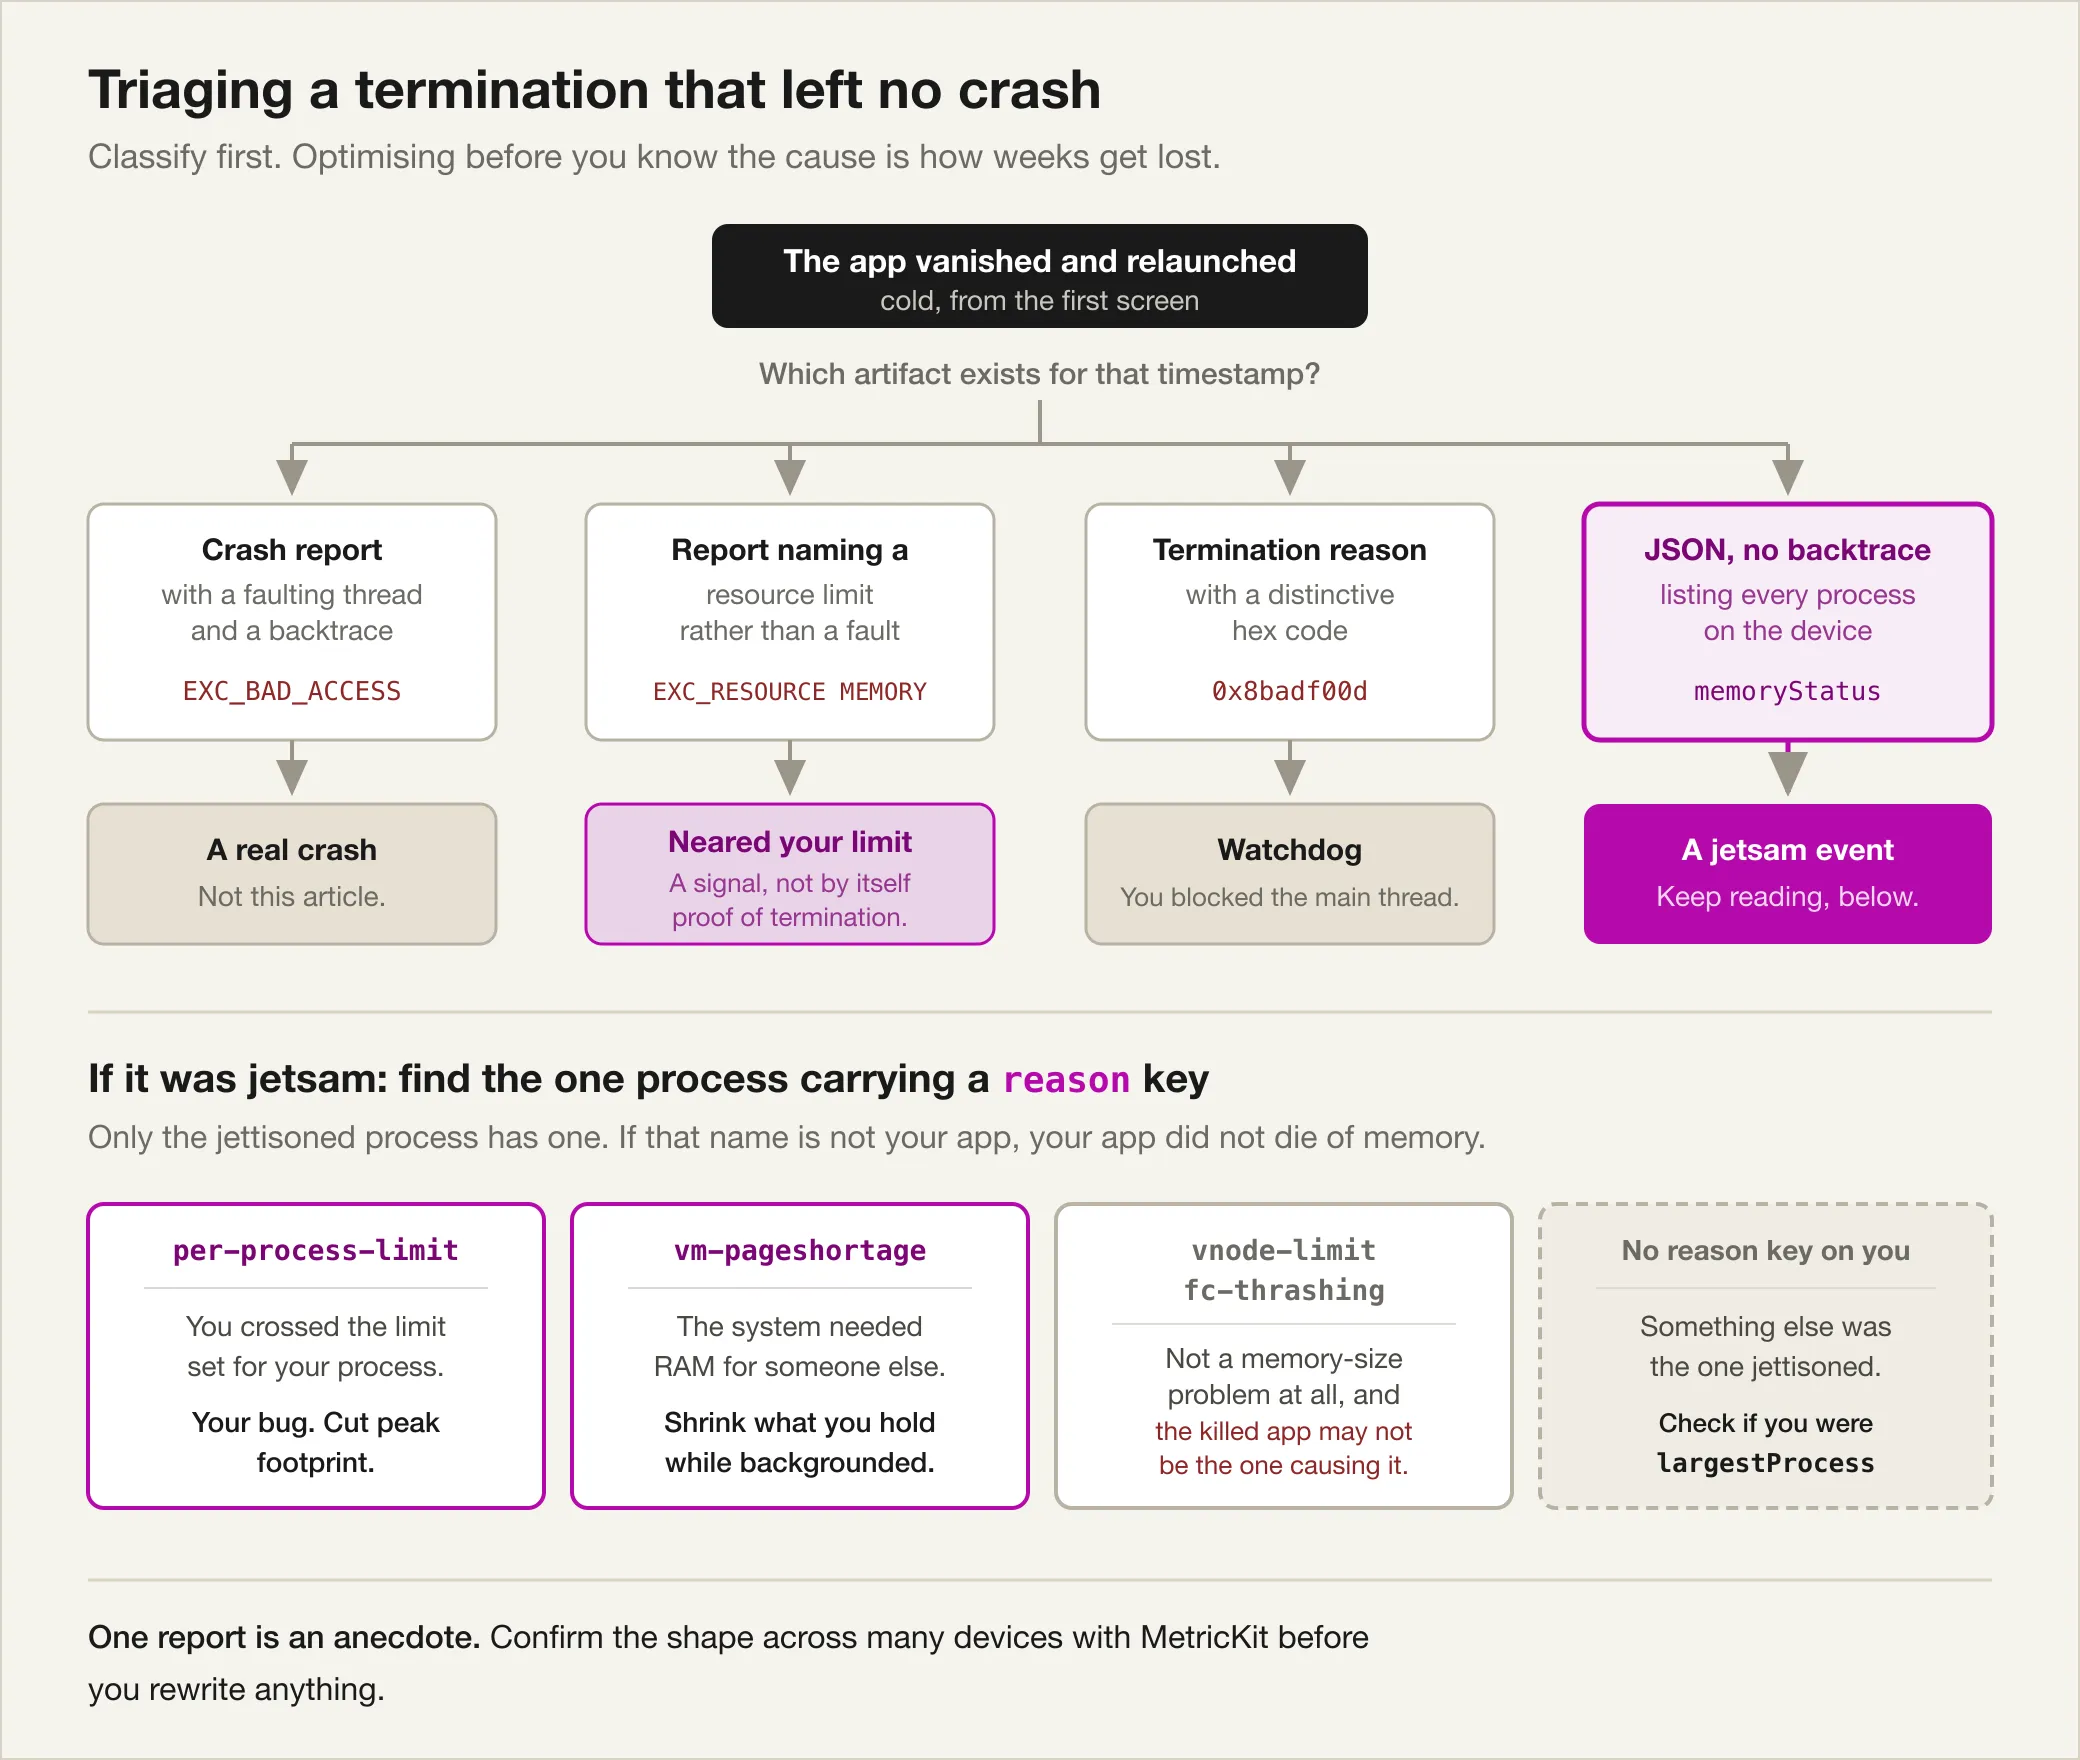
Cross-checking with MetricKit
One report is an anecdote. Before you rewrite anything, confirm the pattern across your real user base, and MetricKit is how you do that.
Be clear about what MetricKit is and is not. It does not hand you jetsam JSON. It gives you aggregated daily reports, which is a different and complementary thing. What it does give you is the ability to tell the failure modes apart at scale.
As of iOS 27, the current API is MetricManager, which delivers reports through async sequences and replaces MXMetricManager and its subscriber protocol. Store the manager somewhere long-lived so the subscription stays active. The complete MemoryTelemetry for iOS 27 snippet shows how to iterate over those reports, normalize memory measurements to bytes, and forward the values to your analytics sink.
A note on the default in the modern snippet. MetricResult carries around thirty cases and the snippet deliberately handles four of them, so a plain default is the right closing clause. You might expect @unknown default instead, since the enum is not frozen and Apple keeps adding cases. It compiles, but on a partial switch like this one it also produces a “switch must be exhaustive” warning listing every case you left out, because @unknown default is meant to catch future cases once you have handled all the current ones. Use @unknown default when you enumerate every case that exists today and want to be told when a new one appears. Use a plain default when you are intentionally interested in only a few.
The shape of the API tells you something worth noticing. memoryLimitTerminationCount exists on both the foreground and background termination metrics, because you can cross your own limit anywhere. systemPressureTerminationCount exists only on BackgroundTerminationMetric, because being reclaimed to relieve system pressure is something that happens to backgrounded processes. That asymmetry is the whole diagnostic, and it is the same split the older API had.
You do not have to wait for a minimum deployment target of iOS 27 to start. Gate the modern path on availability and keep the old subscriber as a fallback, so both populations report into the same counters. The LegacyMemoryTelemetry snippet contains the complete MXMetricManagerSubscriber implementation for that fallback.
Two things people get wrong with the legacy path. MXMetricManager.shared.add(self) is what actually starts delivery, and forgetting it is the usual reason nobody ever sees a payload. Register from a long-lived telemetry owner, and pair registration with remove(self) when you want delivery to stop.
Whichever path you are on, the interpretation is the same:
- Memory-limit terminations climbing means your peak footprint is too high. Attack peak usage.
- System-pressure terminations climbing means your suspended footprint is too high. Attack what you hold while backgrounded.
- Watchdog terminations climbing means you have a responsiveness or lifecycle-timeout problem, often on the main thread, rather than a memory diagnosis.
Pair those counters with peak and suspended memory and you can watch a fix land across your whole user base rather than only on your desk. During development, Debug > Simulate MetricKit Payloads gets you a report without waiting a day, though the values in it are samples rather than your app’s real data.
Common misreadings
Treating the report as a crash log. There is no backtrace. Looking for one and concluding the report is corrupted wastes a genuinely useful document.
Assuming your app was the victim. Only the process with a reason key was jettisoned. Everything else in that array is context.
Reading rpages as bytes. They are pages. So are lifetimeMax and purgeable. Multiply all three.
Assuming every unexplained relaunch is jetsam. It might be a watchdog termination, a real crash whose report failed to upload, the user force quitting, or a system update. Classify before you optimise.
Reproducing memory pressure without fooling yourself
Before the fixes, a word about measurement, because it is very easy to convince yourself of something false here.
Build a small sample app that does one thing, loading and transforming large images in batches, with the batch size as a knob you can turn. A focused harness will teach you more in an afternoon than instrumenting your whole app for a week.
Measure on physical devices, across at least two memory classes, including the oldest device you support. The Simulator, as covered above, cannot show you this failure at all.
Compare Debug and optimised builds, and record which one you used. Debug builds carry extra bookkeeping and skip optimisations that affect object lifetime, so their numbers usually run higher, though not always and not by a predictable factor. Optimised builds are what your users run, so base your budget on those and treat Debug numbers as a rough guide.
Use the right instrument for the question you are asking. Allocations for what is being created and by whom. Leaks for genuinely unreachable memory. VM Tracker and the Memory Graph for how the regions themselves are laid out. Metal diagnostics for GPU-backed resources, which the other tools will under-report.
Above all, keep these five things separate in your head, because they look identical on a graph that only goes up:
- A leak, which is unreachable and never coming back
- A retained cache, which is reachable, deliberate, and unbounded
- A transient peak, which resolves on its own but can still kill you at the wrong moment
- Fragmentation, where the bytes are free but the pages are not
- GPU-backed memory, which counts against you and does not appear where you expect
Fixes, ordered by how much they actually save
Roughly in order of return on effort.
1. Reduce peak concurrency first. Almost every large footprint turns out to be several things alive simultaneously that did not need to be. Processing eight images at once costs eight buffers. Processing them two at a time costs two. Whether that is slower depends on where the bottleneck actually is. If you were bounded by decode throughput the wall-clock difference is often small, and if you were genuinely bounded by parallelism it will not be. Measure both footprint and duration before and after, rather than assuming the trade is free.
2. Downsample before decoding. Covered above. For any image-heavy app this is the largest single win available, frequently by an order of magnitude.
3. Bound your caches. Use NSCache with a real countLimit or totalCostLimit, and know what those limits promise. Apple is explicit that totalCostLimit “is not a strict limit”, that the cache may go over it, and that an object above the limit “could be evicted instantly, at a later point in time, or possibly never”. The eviction order is not guaranteed either. So treat them as pressure valves and hints, not as a hard ceiling you can budget against. If you need a hard bound, enforce it yourself. What is certain is that a Dictionary you are using as a cache will never evict anything at all, because it does not know it is a cache.
4. Release what the user cannot see. When the app backgrounds, drop decoded images, video buffers, and scene content. The user is not looking at them. This is precisely the fix for the vm-pageshortage report above.
5. Stream instead of materialising. Think twice before loading a whole file into a Data to parse it. For small files it is fine and the simplicity is worth it. For anything large, FileHandle, bounded reads, a decoder over a stream, or a memory-mapped read will keep the peak far below the file size. A 200 MB import does not have to cost 200 MB of footprint.
6. Add autorelease pools around bridged batches. Wrap loop bodies that create Foundation temporaries:
for start in stride(from: 0, to: urls.count, by: 8) {
    autoreleasepool {
        for url in urls[start ..< min(start + 8, urls.count)] {
            process(url)
        }
    }
}
The stride form above avoids a dependency. If you prefer the readable version, chunks(ofCount: 8) comes from swift-algorithms, and chunked(into:) is a widely copied extension rather than anything in the standard library.
7. Check capacity, copies and captures. Oversized array buffers, accidental copy-on-write copies, closures capturing more than they need, and the same data held in two representations at once.
8. Configure Metal storage deliberately. Pick storage modes on purpose, and mark genuinely recreatable resources volatile.
Validate every one of these against peak footprint, on a real device, running the original user journey. An optimisation that lowers your average while leaving the peak untouched has not moved you any further from termination, because it is the peak that gets you killed.
Production guardrails
Once you have fixed it, keep it fixed.
Monitor peak and suspended memory through MetricKit and Xcode Organizer, and put both on a dashboard next to your crash rate. If you only track crash-free sessions, jetsam is invisible to you by construction.
Record workload dimensions, not user content. Log image counts, pixel dimensions, batch sizes, and cache occupancy. Never log the data itself.
Set device-class budgets. Test on at least two memory classes, including the oldest device you support, and treat a footprint regression as a build failure the same way you would treat a failing test.
Give extensions their own tests against their own much smaller budget. Do not assume host-app headroom.
Add a release check for missing crashes. If crash-free sessions look fine but session lengths are quietly getting shorter, or relaunch counts are climbing, you may be looking at terminations that no crash reporter will ever show you.
What not to claim
A short list of things that sound authoritative and are wrong.
Do not publish a universal iOS memory limit. It varies by device, OS version, foreground state, and process type. Query it at runtime.
Do not equate ARC with garbage collection, or with the operating system reclaiming pages. Three different mechanisms.
Do not assume every unexplained relaunch is a jetsam event. Classify first.
Do not say iPhone has no swap and therefore must kill. Modern XNU has an embedded freezer that compresses and writes eligible suspended apps out to storage, and supported M-series iPads have broader app swap. What iPhone lacks is macOS-style general-purpose swap for actively running processes.
Do not infer process-selection rules from one device. XNU tells you the bands and the broad ordering, and that is a solid foundation. The tunables, thresholds and per-kill-type policies are not contractual, and they do change.
Do not map user actions onto specific band numbers. Band assignment comes from assertions and system policy. Band 30 on iOS is docked apps, not “anything the user swiped away”.
Do not promise that handling a memory warning prevents termination. Warnings are best effort, they come from a different control loop than jetsam does, and a suspended app cannot act on one at all.
Wrapping up
So the next time an app disappears without a crash report, the first question is not “where is the leak”. It is “which artifact exists for that timestamp”, and then, if it is a jetsam report, “which process has the reason key, and what does it say”. Answer those two and you have converted a ghost into a ticket.
Extensions deserve their own treatment, because a separate process with a much tighter budget breaks assumptions in ways that surprise people. That is the next article.
References
- Identifying high-memory use with jetsam event reports
- Responding to low-memory warnings
- Gathering information about memory use
- Making changes to reduce memory use
- Reducing your app’s memory use
- MetricKit, and specifically MXAppExitMetric and MXMemoryMetric
- Automatic Reference Counting
- MetricKit updates, MetricManager, and Monitoring app performance with MetricKit
NSCache.totalCostLimit, for what the cache limits actually promise- Apple Open Source: XNU. The VM subsystem documentation is the best public description of modern behaviour:
doc/vm/memorystatus.md, the health check, the bands, and the monitored resourcesdoc/vm/memorystatus_kills.md, every kill type and how each one selects a victimdoc/vm/memorystatus_notify.md, the pressure levels and how they differ from jetsamdoc/vm/freezer.md, the embedded freezer, its budget, and band 75bsd/sys/kern_memorystatus.handbsd/kern/kern_memorystatus.c
os/proc.hin the iOS SDK, for theos_proc_available_memorydocumentation quoted above- WWDC 2018, Session 416: iOS Memory Deep Dive
Comments are powered by Giscus (GitHub Discussions). Loading them fetches resources from GitHub.